Anishsapkota000
Nepal

FREELANCER.COM MESSES UP OUR LINKS, SO PLEASE CHECK LINKS IN THE ATTACHED FILE "links.txt".
HERE IS THE PROBLEM:
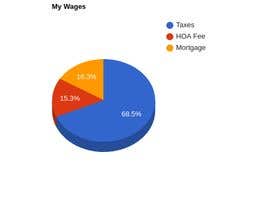
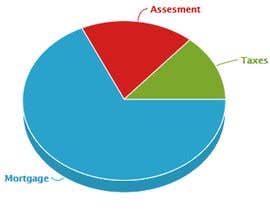
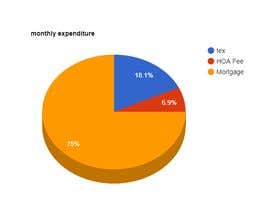
We are using image-charts.com chart generator (see attached chart[1].png file and see link in links.txt).
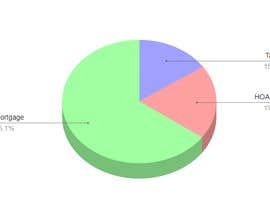
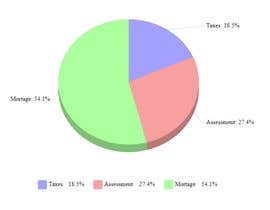
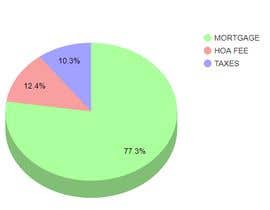
The image-charts.com chart looks ugly, compared to the old Google Charts (see attached [chrome_2020-05-28_21-03-52.png] and links.txt).
The problem is Google API is deprecated and we need a replacement which looks similar to the Google API (NOT similar to image-charts.com). The solution needs to be URL-compatible and either Javascript or free third-party server with available source code and no watermark.
“Very smart freelancer, quickly found the root cause of my problem with Google Charts API.”
![]() afterhourstech, United States.
afterhourstech, United States.

Chapisha Shindano Lako Haraka na rahisi

Pokea Wasilisho Nyingi Kutoka kote ulimwenguni

Tuza wasilisho bora zaidi Pakua faili - Rahisi!
